TR-2026-03
Margin Dispersion Under Proxy-Metric Billing: A Trace-Driven Simulation of Multi-Tenant LLM Inference Economics
Technical Report TR-2026-03 · July 11, 2026
Third in a series. TR-2026-02 measured whole-GPU idle under bursty arrival on real hardware; this report moves from measurement to market structure — what proxy-metric billing does to per-tenant margins when the fleet cost those reports measured gets attributed to customers.
UNCALIBRATED — direction only, not magnitudes. Every constant in this study (GPU cost, throughputs, prices, headroom) is a labeled placeholder in one config file. All dollar figures and margin percentages are illustrative of structure and direction, not estimates of any real provider's economics. Read orderings and shapes, not levels.
Abstract
LLM inference providers bill customers on a proxy metric while their marginal cost accrues in a different unit: GPU-time on a provisioned fleet. We study the tightest proxy in commercial use — per-token pricing; per-minute, per-generation, and per-character schemes are strictly looser proxies, so any leak found here is a lower bound on theirs. Replaying the Azure public LLM inference traces (28,185 production requests) through a transparent GPU-seconds cost model with conservation-checked tenant attribution, we establish one empirical premise and one conditional result. The premise, directly observed: production traffic comprises two request populations — prefill-heavy and decode-heavy — whose GPU-time per billed token differs by orders of magnitude. The result, stated conditionally because the traces carry no tenant identity: if tenants specialize along that prefill:decode axis, uniform token prices produce structural margin dispersion between them. We test the condition by ablation. Tenants synthesized to differ in workload mix realize a ~2.5× spread in fully-loaded margin at identical prices; mix-homogeneous tenants with the same 287× size skew collapse to near-uniform margins. Tenant size heterogeneity alone produces no dispersion; workload-mix heterogeneity is necessary and sufficient. A sensitivity sweep adds a second-order finding that survives any recalibration of constants: as blended margin compresses toward break-even, tenant-margin dispersion widens sharply — so aggregate margin is least informative about the tenant book exactly when the business is most stressed. A marginally profitable provider is running a large, invisible cross-subsidy between workload shapes.
1. Introduction
Usage-based pricing for LLM inference is almost universally denominated in tokens: a price per 1k input (context) tokens and a price per 1k output (generated) tokens. The provider's cost, however, is incurred in GPU-seconds on a fleet that must be provisioned for peak demand and paid for while idle. Tokens are a proxy for GPU-time, and the proxy is imperfect in a specific, systematic way: prefill (context ingestion) is massively parallel and cheap per token, while decode (generation) is sequential and expensive per token — commonly two to three orders of magnitude more GPU-time per token.
Note that per-token billing is the most cost-aligned proxy in production use. Much of the inference market bills on looser ones — per audio-minute, per generation, per character — where the gap between the billed unit and the resource consumed is wider by construction. This study deliberately examines the tightest case: a cross-subsidy demonstrated under token pricing can only be larger under the looser schemes.
This creates a structural question with commercial consequences: when all tenants pay the same per-token prices but differ in workload shape, how unevenly is the provider's margin distributed across them? If dispersion is large, aggregate margin is a misleading health metric — growth in the wrong tenant segment can destroy unit economics even at constant blended margin, and competitors can selectively poach the profitable (over-charged) segment.
Scope of the evidence, stated up front. What the traces observe: real production arrivals containing two request populations with very different cost-per-billed-token, and an arrival process yielding ~58% utilization under our provisioning policy. What they do not observe: tenant identity — and therefore how differently real tenants mix those populations. Tenant structure here is synthesized and parameterized, and the headline claim is accordingly conditional: if tenants differ in prefill:decode mix, uniform pricing cross-subsidizes them. The ablation in §5.2 shows this condition is causal, not decorative.
The pipeline makes three design commitments:
- No hidden constants. Every cost, throughput, price, and provisioning parameter lives in a single config file and is labeled UNCALIBRATED; every emitted table and figure carries the banner.
- Conservation as a code-level invariant. The sum of per-tenant attributed GPU-seconds plus idle GPU-seconds must equal provisioned GPU-seconds within 1e-6 relative tolerance, asserted in the attribution code path (with a dollar-space equivalent in the margin layer); results cannot be produced from an accounting leak.
- Real arrival process, synthetic economics. Request timing and token counts come from production traces; prices, costs, and tenant identity are synthetic and labeled as such.
2. Data
We use the Azure public LLM inference traces (Patel et al., 2023 release): two CSVs of production request logs with per-request timestamp, context-token count, and generated-token count.
| Trace | Requests | Character |
|---|---|---|
| code | 8,819 | prefill-heavy: high context, short generations |
| conv | 19,366 | decode-heavy: conversational, longer generations |
| Total | 28,185 | one contiguous hour, 2023-11-16 18:15–19:14 UTC |
Across the merged trace, the mean request carries 1,434 context and 154 generated tokens (median 1,046 / 90; max 14,050 / 1,899). Two properties matter for interpretation: the window is a single busy hour (so idle capacity in the simulation reflects headroom policy, not diurnal troughs), and the traces carry no tenant identity (so tenant structure must be synthesized; §3.3).
3. Method
3.1 Token → GPU-seconds, and the isolation-costing choice
Each request's GPU-time is modeled as two linear terms with distinct throughputs:
gpu_seconds(r) = context_tokens(r) / prefill_rate
               + generated_tokens(r) / decode_rate
with placeholder rates of 8,000 prefill and 80 decode tokens per GPU-second — a 100× per-token cost asymmetry, the load-bearing stylized fact of the study.
This is isolation costing, and it is the central modeling choice a serving-systems reader should interrogate, so we defend it here rather than in a footnote. Production serving stacks (vLLM-style continuous batching — the stack TR-2026-02 measured) do not cost requests independently: decode steps are batched across concurrent requests, so a request's marginal GPU-time depends on fleet load at the moment it runs — tenants' costs are coupled, not additive. We cost in isolation anyway, for two reasons. First, it is what makes the conservation invariant exact and the attribution auditable; a load-coupled model moves the arbitrary choice from "throughput constant" to "marginal-vs-average allocation rule" without removing it. Second, the direction of the error is known and is itself part of the finding: isolation costing overstates how cleanly cost can be attributed to a tenant. Under batching, per-tenant cost depends on who else is on the fleet — which strengthens, not weakens, the core contention that per-tenant profitability is unobservable from the billing meter alone and must be measured at the serving layer.
3.2 Arrival-driven provisioning and idle
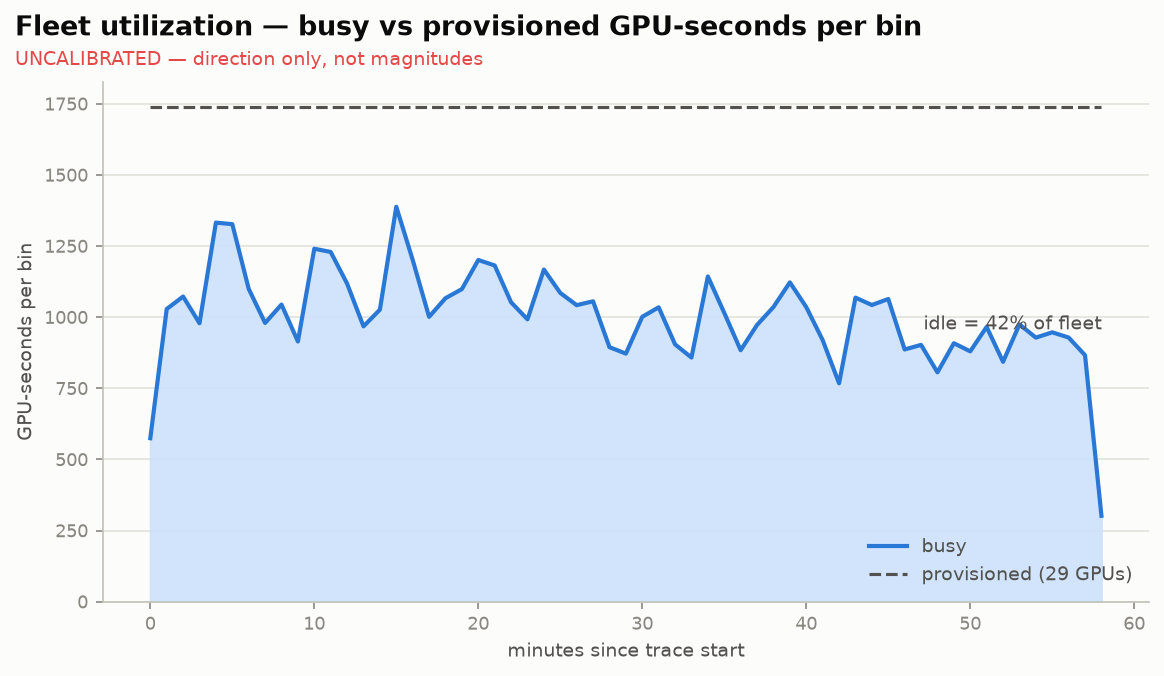
Requests are binned by arrival time into 60-second bins, charging each request's full GPU-seconds to its arrival bin. Demand per bin, in GPUs, is busy-GPU-seconds / 60. The fleet is provisioned flat for the whole window: fleet_gpus = ⌈peak binned demand × headroom⌉, with headroom 1.25. On the trace this yields a peak demand of 23.1 GPUs, a 29-GPU fleet, and 102,660 provisioned GPU-seconds (59,235 busy + 43,425 idle) — 57.7% utilization.
3.3 Tenant synthesis
Tenant identity is synthetic, seeded, and two-dimensional:
- Size heterogeneity: 20 tenants receive traffic shares drawn from Dirichlet(α=0.5) — realistic concentration (top tenant ≈ 31% of busy GPU-seconds; largest/smallest ratio ≈ 287×).
- Mix heterogeneity: each tenant receives a source-affinity vector drawn from Dirichlet(α=0.3) over {code, conv}, so tenants differ in workload shape (per-tenant code-share spans 0.00–1.00, median 0.21).
Mix heterogeneity is an assumption injected here, not an observation — the traces cannot tell us how specialized real tenants are. It is the antecedent of the paper's conditional claim, and §5.2 measures exactly what happens when it is removed.
3.4 Attribution and the conservation invariant
Busy GPU-seconds are attributed to tenants by summing their requests' modeled GPU-time. Before any result is returned, the pipeline asserts
Σ tenant_gpu_seconds + idle_gpu_seconds = provisioned_gpu_seconds (rel tol 1e-6)
raising otherwise. Unit tests verify the invariant trips on two deliberate corruptions (leaked idle accounting; unmetered per-request usage).
3.5 Revenue and margin
Revenue applies uniform synthetic prices — $0.014 per 1k generated and $0.0003 per 1k context tokens — to every tenant. Cost is priced at $2.00 per GPU-hour on two bases: direct (busy GPU-seconds only; idle as house overhead) and fully-loaded (idle allocated pro rata by busy share; allocated costs provably sum to full fleet cost within the same tolerance). Fully-loaded margins are reported unless stated.
3.6 Sensitivity
A one-at-a-time sweep reruns the entire pipeline (tenant assignment held fixed) across decode throughput {40…160 tok/GPU-s}, generated-token price {$0.007…$0.028 /1k}, and headroom {1.0…2.0}, recording fleet economics and tenant-margin dispersion at each point.
4. Baseline results
Under baseline placeholders, the hour of traffic produces $72.81 revenue against $57.03 fleet cost ($32.91 busy + $24.13 idle): 21.7% blended margin at 57.7% utilization. (All dollar and percentage magnitudes are linear in the placeholder constants; read orderings and shapes, not levels.)
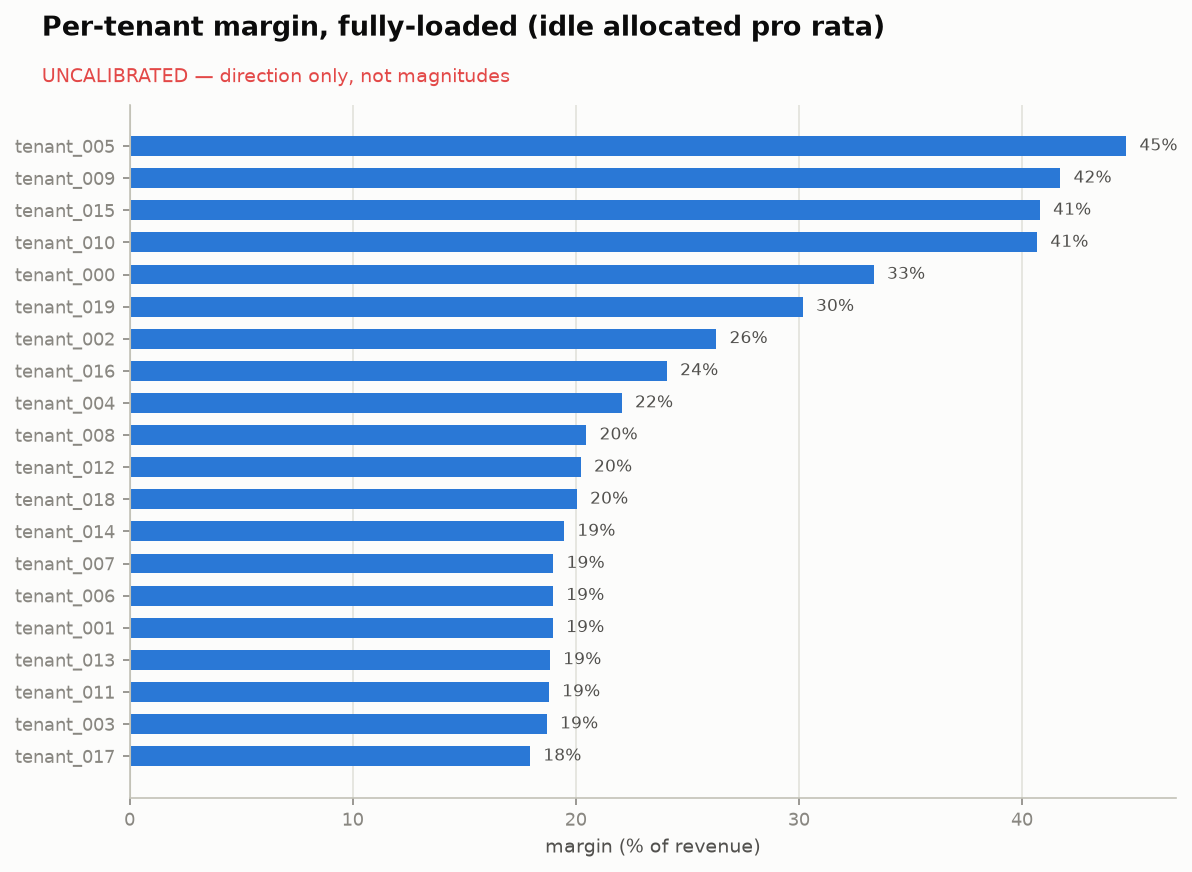
Behind that single blended number, tenant margins range from 17.9% to 44.7% (p10 18.8%, median 20.3%, p90 40.9%). The ordering is what the cost asymmetry predicts and is robust to recalibration: tenants whose mix skews to prefill-heavy code traffic are cheap to serve per billed token and occupy the top of the range; decode-heavy conversational tenants cluster at the bottom. Tenant size does not predict margin — the largest and smallest tenants can sit at either end.
5. Findings
5.1 Conditional on mix heterogeneity, uniform proxy prices ⇒ structural dispersion
Given tenants that differ in prefill:decode mix, a ~2.5× spread in realized margin exists with no difference in negotiated terms: every tenant faces identical prices. The dispersion is created entirely by the interaction of a uniform token price with a ~100× per-token cost asymmetry between prefill and decode. The traces supply the asymmetry — both request populations demonstrably exist in production traffic; the tenant specialization is the assumed antecedent, tested next.
5.2 Ablation: dispersion requires mix heterogeneity — size alone produces none
With tenants assigned i.i.d. — identical expected workload mix — margins collapse to near-uniformity (every tenant within ~0.2 points of the blended figure) despite an unchanged 287× size spread. This is the paper's cleanest result: tenant size heterogeneity alone produces no margin dispersion under proxy billing; workload-mix heterogeneity is necessary and sufficient (given the cost asymmetry). Two corollaries. For analysts: any margin analysis that segments tenants by revenue rather than workload shape will miss the phenomenon entirely. For scope: in a market segment where all tenants genuinely share one workload shape, this mechanism predicts low dispersion along this axis — the question becomes which other cost-relevant axis (arrival burstiness, real-time constraints, session length) tenants diverge on.
5.3 Margin compression widens dispersion
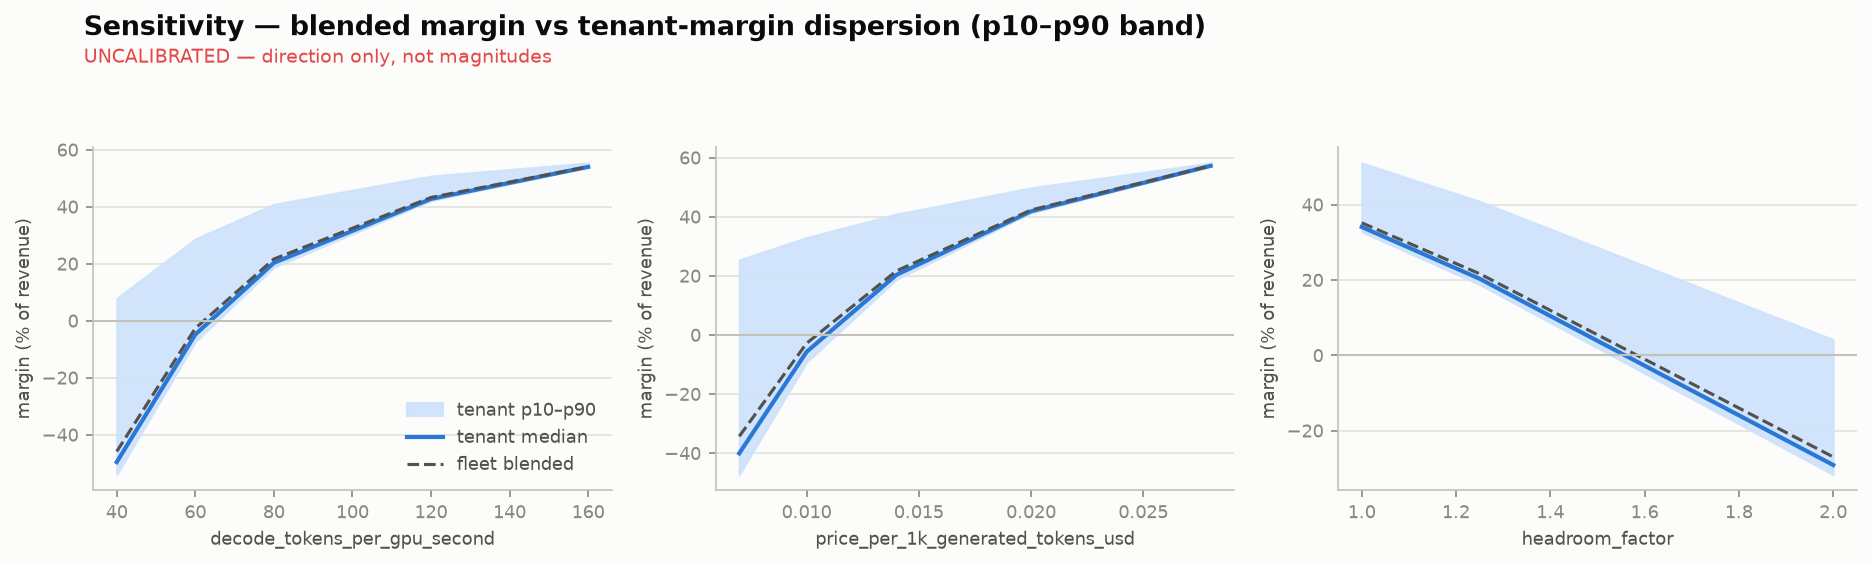
Across all three swept parameters the same second-order pattern appears (fleet margin % / p90–p10 tenant spread in points / tenants negative of 20):
| Lever | Comfortable end | Baseline | Stressed end |
|---|---|---|---|
| Decode throughput (160→40 tok/GPU-s) | +54.1 / 1.5 / 0 | +21.7 / 22.1 / 0 | −45.9 / 61.8 / 16 |
| Gen-token price ($0.028→$0.007) | +57.3 / 1.0 / 0 | +21.7 / 22.1 / 0 | −34.3 / 72.6 / 15 |
| Headroom (1.0→2.0) | +35.2 / 18.3 / 0 | +21.7 / 22.1 / 0 | −27.0 / 35.8 / 16 |
When the fleet is comfortably profitable, all tenants look similar (spread ≈ 1 point). As blended margin approaches zero, the spread fans out to 35–73 points and a majority of tenants go individually negative while a prefill-heavy minority remains profitable. Blended margin is least informative precisely where accuracy matters most: a provider near break-even is not uniformly near break-even — it is running a large cross-subsidy from prefill-heavy to decode-heavy tenants. Unlike the level results, this widening is a shape property of the model, not a function of any single placeholder.
5.4 Idle allocation transmits provisioning policy into tenant margins
Utilization moves from 69.7% (headroom 1.0) to 35.6% (headroom 2.0), swinging blended margin by ~62 points. Since idle is allocated pro rata, headroom acts as a uniform multiplicative cost shock that widens percentage dispersion because low-margin tenants sit closer to the zero line. The limits of this finding are flagged plainly: on a single busy hour, idle is the headroom knob. Demand-driven idle — diurnal troughs, bursty arrivals, the phenomenon TR-2026-02 measured at up to 98–99.9% of the billed window on real hardware — is not observable in this window and needs the week-long 2024 trace (§7).
6. Threats to validity
- The dispersion is conditional, not observed. The traces prove the two request populations exist; they cannot prove tenants specialize between them. Dirichlet(α=0.3) directly controls how extreme synthetic specialization is, and §5.2 shows the result vanishes when it is removed. Treat "tenants differ in mix" as the paper's assumed antecedent, priced accordingly.
- Isolation costing (no batching or queueing). Discussed and defended in §3.1; the residual caveat stands. Real batched serving couples tenants' costs; linear attribution is the auditable approximation, and it overstates attribution cleanliness.
- Uncalibrated constants (by design). Only signs, orderings, and qualitative shapes should be read. The prefill/decode asymmetry direction is robust; its magnitude (here 100×) directly scales the dispersion levels.
- Arrival-bin charging. A request's full GPU-time is charged to its arrival bin; long generations spill into later bins in reality, smoothing demand and slightly changing peak-based fleet sizing.
- One hour of trace. Idle reflects headroom only; utilization-driven idle is absent (§5.4).
- Flat fleet, single GPU class, uniform prices. Autoscaling, hardware tiering, and negotiated per-tenant pricing are additional dispersion channels (or mitigations) not modeled.
7. Conclusion
Billing LLM inference on tokens while paying for GPU-time embeds a systematic transfer between customer workload shapes — and token pricing is the best case; looser billing units (per minute, per generation, per character) widen the gap between billed unit and consumed resource by construction. In a trace-driven simulation with conservation-checked accounting, uniform prices over mix-heterogeneous tenants produced a 22-point p10–p90 margin spread at a healthy blended margin, widening past 60 points — with most tenants individually unprofitable — as blended margin compressed to zero.
Directionally, this argues that (i) per-tenant margin, segmented by workload shape rather than revenue, is a first-class metric for inference providers; (ii) blended margin degrades as a health signal exactly as it compresses; and (iii) the obvious pricing fix — separate prefill and decode rates — is not a one-time repricing but a continuous measurement problem: setting the right differential requires knowing true per-tenant GPU-time cost, which the billing meter does not observe (and which batching couples across tenants, §3.1), and tenant mix drifts as their own customer bases change. A price set correctly today is silently wrong after the next product launch — the durable capability is per-tenant cost measurement at the serving layer, not any particular price sheet.
Future work, in order of evidentiary value: rerun on the week-long 2024 trace, where diurnal troughs and bursty arrivals make idle demand-driven rather than policy-driven (connecting this simulation to TR-2026-02's hardware measurements); calibrate constants against measured serving benchmarks; model batched decode to quantify the coupling that isolation costing sets aside; and map the dispersion axis for non-text modalities, where billing proxies are looser and the cost-relevant workload axes (real-time factor, session length, interruption patterns) differ from prefill:decode.
Reproducibility
All code, one config file, and two public CSVs reproduce every number and figure (conservation asserted on every pass; 15 unit tests including negative controls). Published alongside this report: full pipeline source + tests, per-tenant margin table, sweep results, utilization timeline and fleet summary. Reproduction:
python3.11 -m venv venv && venv/bin/pip install pandas numpy pyyaml matplotlib pytest
# download the two Azure trace CSVs into data/ (see README)
venv/bin/python run.py
References
- Azure Public Dataset — LLM inference traces (2023). github.com/Azure/AzurePublicDataset
- Patel, P., Choukse, E., et al. Splitwise: Efficient Generative LLM Inference Using Phase Splitting. ISCA 2024. (Source of the published traces and the prefill/decode phase asymmetry.)
- TR-2026-02: Whole-GPU Idle Under Bursty Request Arrival. This series.
Correspondence: github.com/AgentMulder404. The pipeline is deliberately small and fully published — reruns with different placeholder constants, tenant parameterizations, or the 2024 week-long trace are actively solicited.